Overview
AIM-Technology-Japan V2.1 is a national version of AIM/Technology for the 10 subregions in Japan, which was previously called AIM/Enduse-Japan. The model descriptions are also summarized in [1].
Model structure
AIM-Technology-Japan V2.1 is a recursive dynamic partial equilibrium energy system model. The energy efficiency and cost of each technology, energy service demands, energy prices, and technological constraints such as primary energy resources, are provided to the model as exogenous parameters. Final energy demand, primary and secondary energy supply, greenhouse gas emissions, energy system costs, and carbon prices are estimated as output variables. Individual energy technologies are explicitly modeled, and energy demand, supply, and emissions are estimated based on the energy and service inputs and outputs of each technology. Energy technologies are selected using linear programming to minimize total annual energy system costs, including capital cost, energy cost, operation and management cost, and emission cost. The capital costs of energy technologies are annualized using a discount rate in the range of 10–33% (Oshiro et al. [2], Fujimori et al. [3]). For CCS-related technology, it is set to 20%.
The end-use sectors comprise the industry, buildings, and transportation sectors, which are disaggregated into several subsectors with respect to types of products and buildings as well as transport modes. The energy transformation sector covers power and heat generation, coal and oil upgrading, gas works, and hydrogen generation. The energy technologies modeled in each sector are summarized below.
| Sector | Technology options |
|---|---|
| Industry | Next-generation coke oven, COG recovery, coke dry quenching, direct-current electric furnace, blast furnace with CCS, BOG recovery, top pressure recovery turbine, sintering furnace heat recovery, energy efficiency in steelmaking process, hydrogen-based DRI-EAF, vertical roller coal mill, vertical roller clinker mill, high-efficiency clinker cooler, innovative cement production process, cement kiln with CCS, energy-efficient grinding mill, high-performance pulp washing device, high-efficiency black liquid boiler, high-efficiency delignification device, plate evaporator, high-efficiency paper press and drying process, heat recovery in petrochemical process, naphtha catalytic cracker, heat-integrated distillation column, high-efficiency industrial boiler, industrial heat pump, electric furnaces, hydrogen-based furnace and boiler, high-efficiency motor, inverter for industrial motor, high-efficiency agricultural device |
| Buildings | High-efficiency air conditioner, high-efficiency stove, high-efficiency water heater, electric water heater, electric heat pump water heater, fuel cell, high-efficiency cooking devices, electric cooking hob, high-efficiency lighting, high-efficiency appliance, bioenergy use, high-performance building envelope |
| Transport | Fuel economy improvement in internal combustion engine, hybrid electric vehicle, plug-in hybrid electric vehicle, battery electric vehicle, fuel-cell electric vehicle, compressed natural gas vehicle, biofuel, high-efficiency train, high-efficiency ship, high-efficiency aircraft, Ammonia-fueled ship |
| Energy transformation | IGCC w/CCS, IGCC wo/CCS, IGFC w/CCS, IGFC wo/CCS, gas CC w/CCS, CC wo/CCS, Fuel cell gas CC w/ or wo/CCS, nuclear, onshore wind power, offshore wind power, solar photovoltaic, geothermal, bioenergy, hydropower, ocean power, hydrogen-based gas turbine, pumped hydro storage, reinforcing electricity interconnection capacity, biomass to liquids, power to hydrogen, coal/gas to hydrogen (w/ and w/o CCS), biomass to hydrogen (w/ and w/o CCS), synthetic fuel production, methanation |
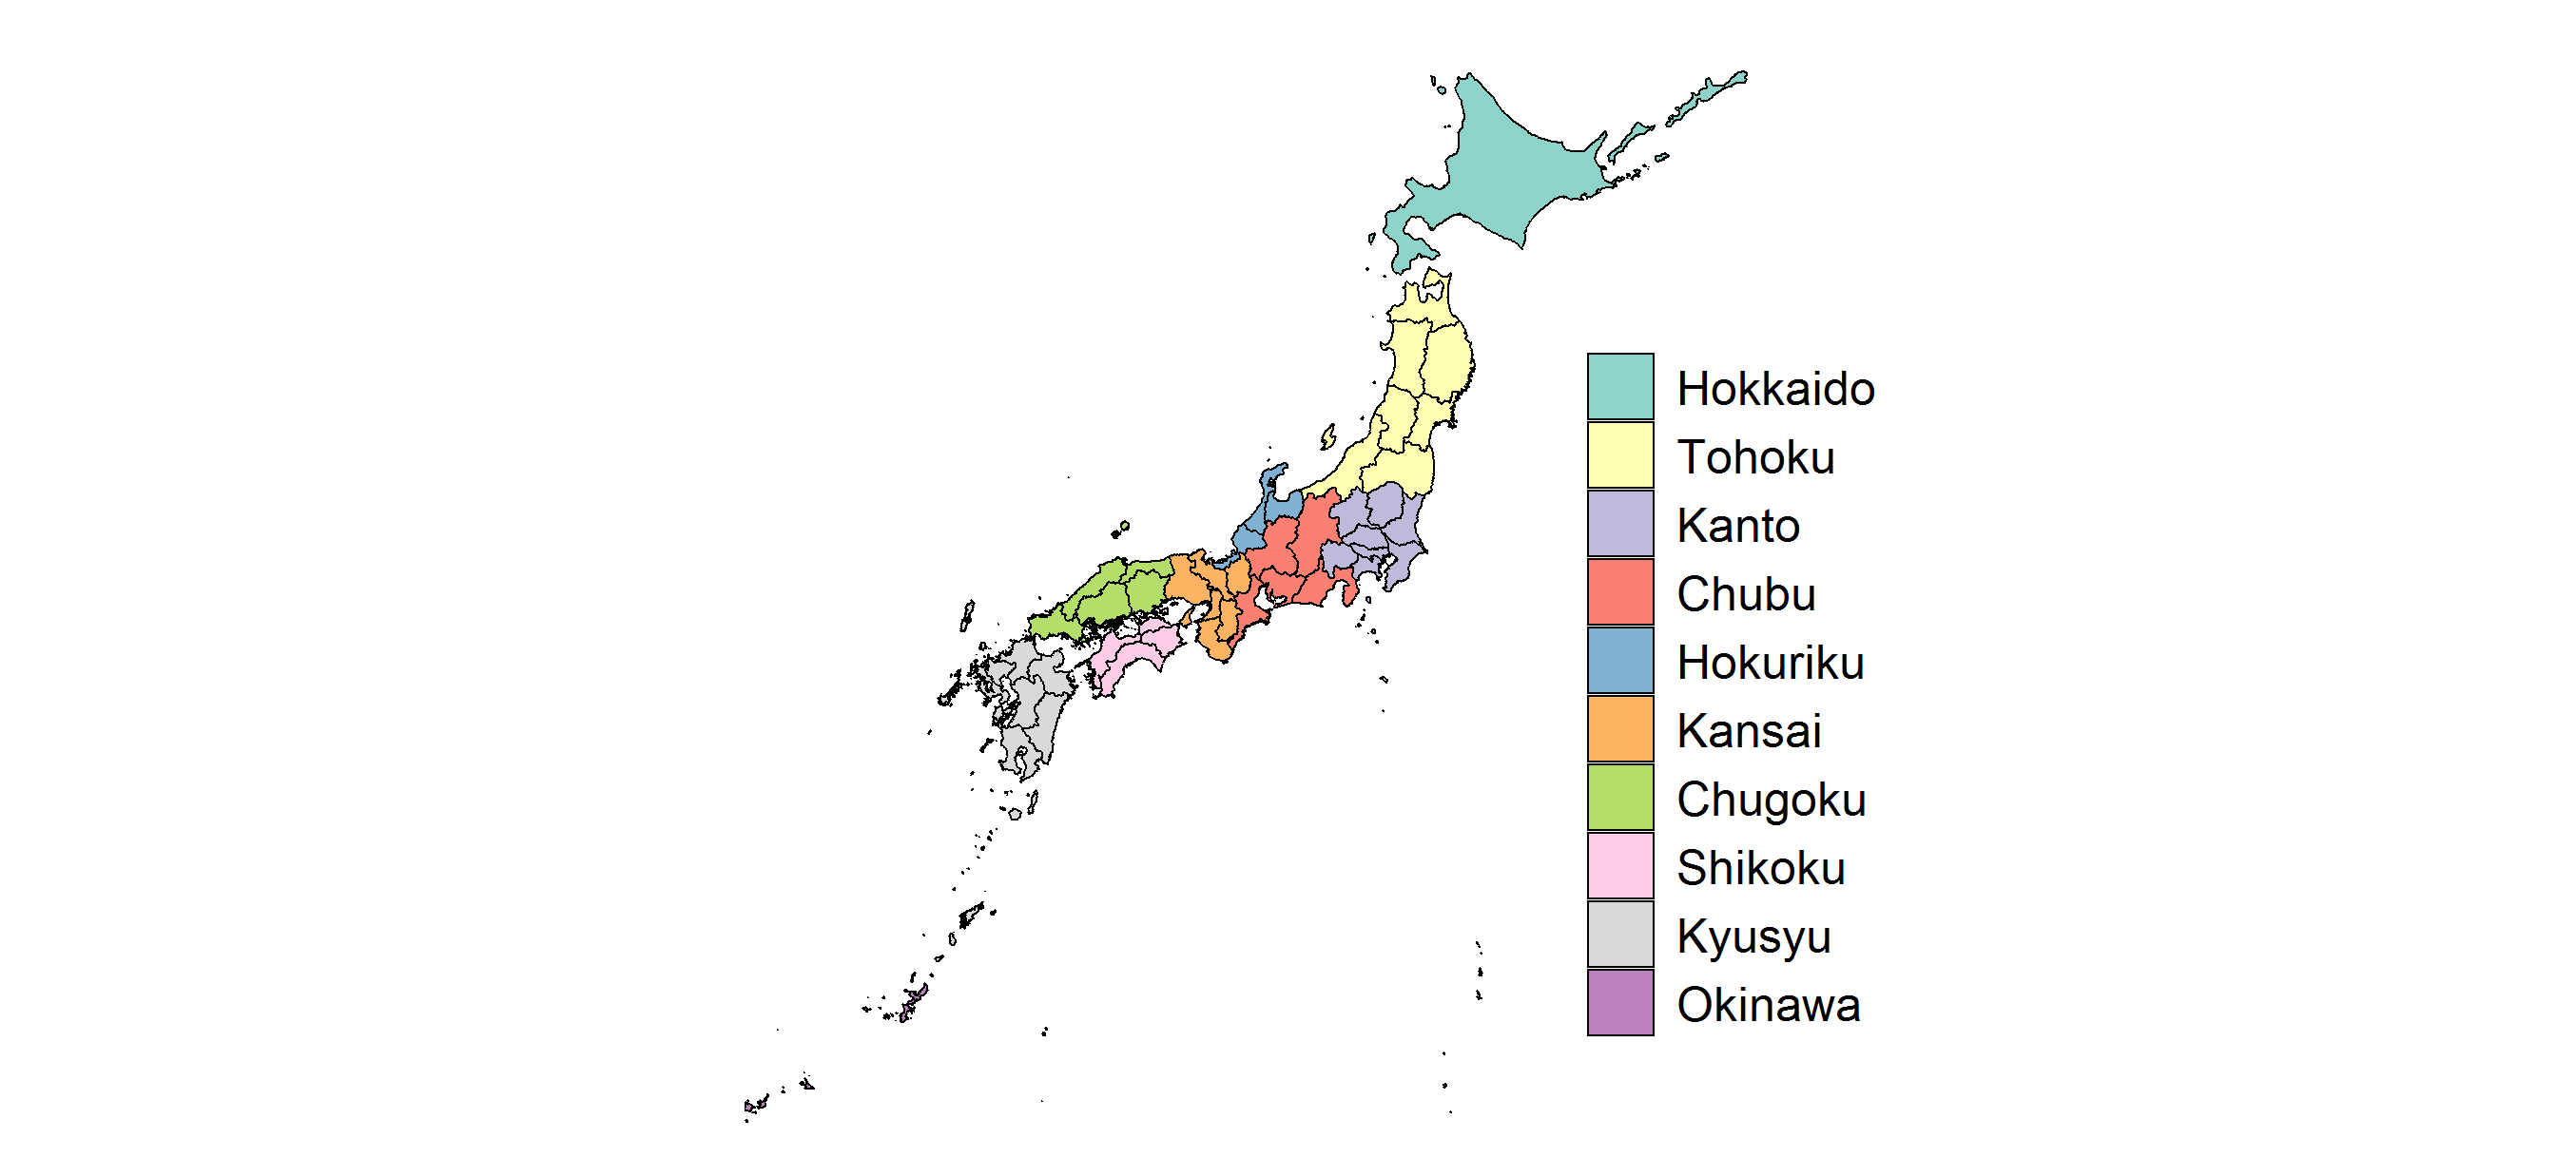
As shown below, the major regions are divided into 10 subregions, which correspond roughly to the service areas of major power utilities. As most regional energy and economic data are available at the prefecture level, the regional classification is based on the boundaries of Japan’s 47 prefectures. For energy supply sectors, region-specific characteristics such as renewable potential and capacity for electricity interconnection are considered. In the buildings and transport sectors, regional energy demand profiles in the base year are obtained from prefectural energy statistics in Japan [4,5], whereas for the industrial sector, the energy intensity of commodities is set as equal to the national average due to a lack of regional energy statistical data for each industrial subsector. Details of this regional treatment can also be found in Oshiro et al. [6].